
How many sales until you're in profit?
Enter your fixed costs, price, cost per unit and fees to see how many units cover your costs, the units for the profit you want, and a chart of profit against sales.
Break-Even Calculator
No sign-up. What you type never leaves your device.
The starting numbers are only an example. Fixed costs are what you pay whatever you sell, such as software, rent, salaries and a product launch budget. Use the same period, such as a month, for every number. Currency changes the symbol only.
LossProfitBreak-evenProfit target
How it’s calculated
Fees per unit = price × fee %Contribution margin = price − variable cost − fees per unit. It’s what each sale puts toward fixed costs and then profit.Contribution margin ratio = contribution margin ÷ priceBreak-even units = fixed costs ÷ contribution margin, rounded up to a whole unit.Break-even revenue = fixed costs ÷ contribution margin ratioUnits for a profit target = (fixed costs + target) ÷ contribution margin, rounded up.Profit = units × contribution margin − fixed costs, which is the line on the chart.Margin of safety = (expected units − break-even units) ÷ expected units: how far sales can fall before you lose money.
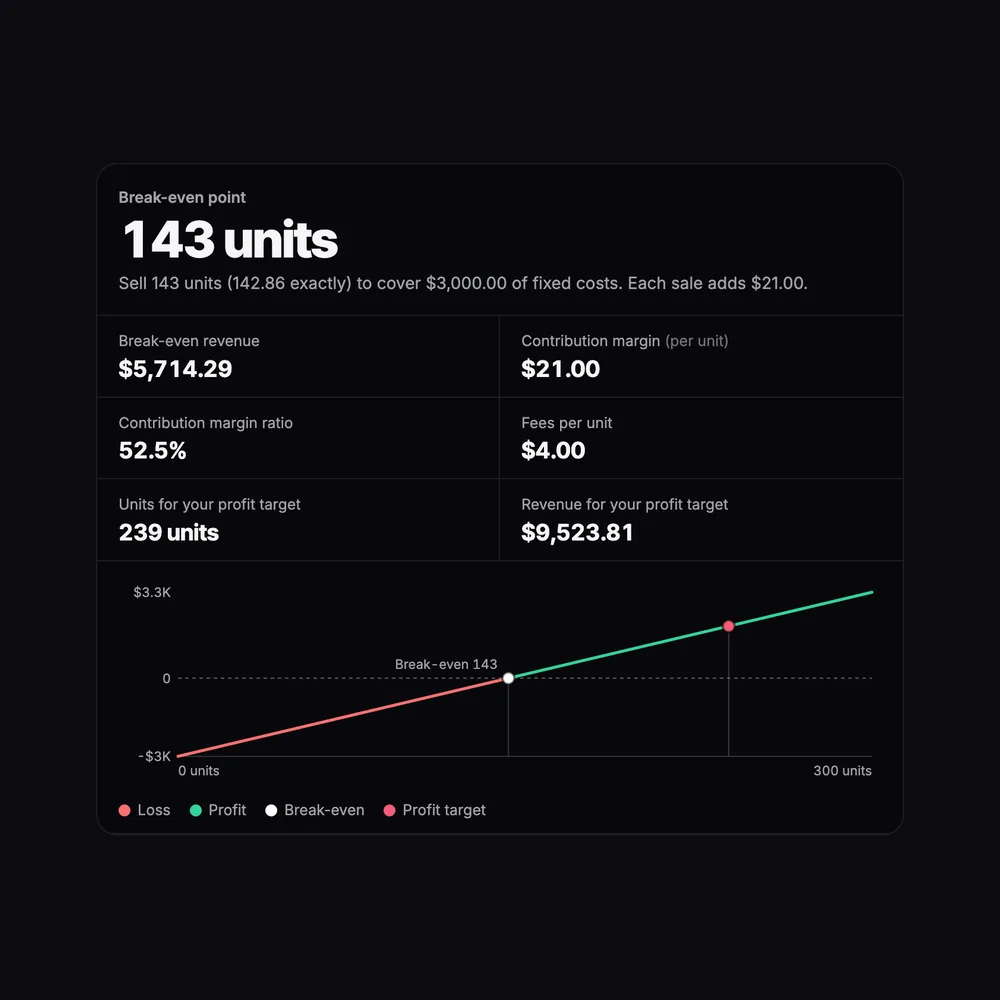
Example: 3,000 fixed, a 40 price, 15 variable cost and 10% fees give 4 in fees and a contribution margin of 21. 3,000 ÷ 21 = 142.86, so you break even at 143 units.
Ready to sell more units? Write product descriptions that convert →
Everything you need, nothing you don't
Break-even units
Fixed costs ÷ contribution margin, rounded up to whole units.
Break-even revenue
The sales you need to cover fixed costs, from the contribution margin ratio.
Profit target
The units and revenue you need to make the profit you want.
Contribution margin
What each sale adds after variable costs and fees, in money and as a ratio.
Profit chart
Profit against units sold, with the break-even point and your target marked.
Margin of safety
Enter expected sales to see profit and how far sales can drop before a loss.
Done in 3 steps
Enter fixed costs
What you pay for the period whatever you sell.
Add per-unit numbers
Selling price, variable cost and fees as a % of the price.
Read the result
Break-even units and revenue, the units for your target, and the chart.